Wednesday, February 29, 2012

SDO Composite Images from 2012-02-29

This is a montage of the most recent data from the SDO's Atmospheric Imaging Assembly. The upper left shows the photosphere, the visible light from the Sun gathered by the 4500Å filter. You can see sunspots in this wavelength. The other three images are composites of various other channels. These types of composite images let us see several levels of the solar atmosphere at once.

Monday, February 27, 2012

VIDEO: Filament Eruption on 2012-02-27

This video shows a large filament eruption on the northeast limb today. I made it from almost 2100 images, 21 hours of data from 00:00 to 21:00.

Friday, February 24, 2012

SDO Composite Images from 2012-02-24

Composite image made from today's SDO AIA 211Å, 193Å, and 171Å data.


Composite image made from today's SDO AIA 94Å, 335Å, and 193Å data.


Composite image made from today's SDO AIA 304Å, 211Å, and 171Å data.

VIDEO: Filament Eruption from the SDO on 2012-02-24

This 211Å, 193Å, and 171Å composite video highlights a large filament eruption. It shows the northeast section of the Sun for 12 hours from 00:00 to 12:00. A composite video like this lets us see the action from the transition region all the way up into the corona. The red is the 211Å channel and represents temperatures around 3.5 million Fahrenheit. The green shows the 193Å channel which highlights temperatures around 2.25 million degrees Fahrenheit. And the blue is the 171Å channel with temperatures around 1.8 million degrees Fahrenheit.

Thursday, February 23, 2012

The Sun Today from the SDO

This is what the Sun looks like today from the Solar Dynamics Observatory. The image in the upper left is from the 4500Å filter showing the photosphere of the Sun. That is the light-emitting surface, what we see with our eyes. There are some sun spots rotating toward the horizon near the western limb. The other three images are composites made from combinations of data gathered by various EUV filters on the SDO satellite.

Tuesday, February 21, 2012

VIDEO: Lunar Transit from the SDO

Here is a 211Å, 193Å, and 171Å composite video of today's lunar transit. It shows the Sun for 4 hours from 00:00 to 16:00. Through the middle of the video the Moon can be seen passing between the SDO and the Sun!

Monday, February 20, 2012

193Å Running Difference Image

This is a running difference image, a simple graph representing the differences between two images gathered at different times. This one was made using the SDO AIA 193Å data from 00:30 and 01:30 on 2012-02-20. The original pair of images show us thermal characteristics of the Sun's corona, a region with temperatures typically around 1.25 million K, or about 2.25 million degrees Fahrenheit. This part of the Sun's atmosphere is tens of thousands of kilometers above the photosphere. The photosphere is the part that emits the light we see. The source images were acquired an hour apart, and the single image you see above is the result of processing them into a running difference graph.

Friday, February 17, 2012

SDO Composite Image - 2012-02-17

This is a composite image made using today's data from the SDO's AIA 94Å, 335Å, and 193Å channels. The original data is in black and white. The colors are created by making the data into a standard red, green, blue image, the kind we typically see on computer monitors.

Wednesday, February 15, 2012

VIDEO: Close Up from SDO AIA 171Å

The 171Å filter is designed to show coronal loops, those arcs you see extending off of the Sun where plasma is moving along magnetic field lines. Most of what you see here is activity in the corona and upper transition region.

The Sun from the SDO 2012-02-15

This montage shows the Sun this morning as seen from the Solar Dynamics Observatory. The one in the upper left is from the 4500Å filter. It shows the photosphere of the Sun, or the light-emitting surface. There are some obvious sun spots in the northeast and another group in the southwest. The other three images are composites made from combinations of data sets acquired by various filters on the SDO satellite.

Monday, February 13, 2012

VIDEO: M9-Class Flare from 2012-01-23

I made this video a few weeks ago. It shows a particularly energetic solar flare as seen by the SDO's AIA 171Å filter. Note the little Earth in the upper right corner. It is scale to size, but obviously not to distance.

Today's Sun from the SDO

Here is a composite image made using current data from the SDO's AIA 304Å, 211Å, and 171Å channels. The data is acquired in black and white. The colors are created by making the data into a standard red, green, blue image, the type of image we typically view on computer monitors. It takes each of the three data channels and uses one for each of the colors.

The original data images were gathered just a half hour ago. The Solar Dynamics Observatory takes hundreds of images of the Sun every hour and instantly relays them back to Earth. Then NASA and the SDO team make them available for scientists to use for research in almost real time.

Sunday, February 12, 2012

Introduction to Running Difference Images

This is a running difference image. It is a simple graph representing the differences between two images gathered at different times. This one was made using the SDO AIA 171Å data from 01:00 and 02:00 on 2012-02-13. The original pair of images show us thermal characteristics of the Sun's transition region and corona, a region with temperatures typically around 1 million K, or about 1.8 million degrees Fahrenheit. This part of the Sun's atmosphere is several thousand kilometers above the part that emits the light we see, or the photosphere. The source images were acquired an hour apart, and the single image you see above is the result of processing them into a running difference graph.

In future articles I plan to explain exactly how these types of images are made and how running difference graphics like this are used as scientific research tools. Stay tuned!

VIDEO: Eastern Limb Solar Flares

I made this video using data from NASA's SDO satellite. It gives you a close-up view into a couple layers of the Sun's atmosphere. The details are much better if you watch it at YouTube in 720p HD.

The Atmospheric Imaging Assembly (AIA) on board the Solar Dynamics Observatory is a series of devices set up to take images of the Sun every few seconds and through a variety of filters. This video is a 18-1/2 hour series of data gathered by the 304Å and 171Å filters. The 304Å filter is designed to see areas of cooler dense filaments and prominences of plasma above the visible surface of the Sun, while the 171Å filter is especially good at showing loops and arcs, activity mostly in the upper transition region and corona. The video shows an active region on the eastern limb from 00:00 to 18:30 on 2012-02-12. There are just over 3700 images used to make the frames for the video, 1850 of each wavelength. What you're seeing here is actual time sped up by almost 1000 times.

The Sun Right Now

These images show the Sun right now as seen from the SDO. The one in the upper left is from the 4500Å filter. It shows the photosphere, what we think of as the light-emitting surface of the Sun. There are some very obvious sun spots just to the west of center. The other three images are composites, each made from a combination of three original data sets taken from various filters on the Solar Dynamics Observatory satellite.

Saturday, February 11, 2012

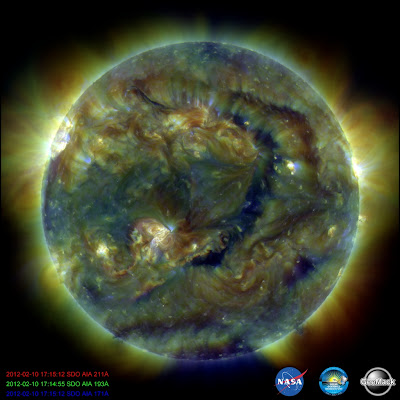
The Sun

The Solar Dynamics Observatory is a satellite designed to take pictures of the Sun in several wavelengths, many hundreds every hour. This is a three color composite of images gathered with the 211Å, 193Å, and 171Å filters.